Gaidge CEO Ryan Moynihan talks net production, net collection, new patient calls, exams, and starts to provide a readout of how COVID-19 impacted the industry in 2020
This was an unprecedented year for orthodontic practices. And now the question is: How did both practices and the industry as a whole fare amid the pandemic? The good thing is there are a number of metrics that can provide the answer. Orthodontic Products spoke to Ryan Moynihan, CEO of Gaidge, the business analytics provider, to find out where performance lagged compared to 2019 and whether or not there was some good news in the end.
Orthodontic Products: Looking back at Q1, how did the year start for orthodontic practices?

Ryan Moynihan: From our view, based on data, the year started off well, but it didn’t appear we were headed for growth. At Gaidge, we regularly recommend looking at five key metrics to determine practice and overall industry health: Net Production, Net Collection, New Patient Calls, Exams and Starts. For the first two months of 2020, the industry average for all U.S. practices across each one of these metrics was flat with a range of +/-1% compared to 2019. When we experienced the industry shutdown on March 16, most offices lost the final 12 days of production in March/Q1. The industry was hit with declines across all metrics as most expected. The U.S. averages compared to 2019 across each of the five key metrics were reported: Net Production (-6.4%), Net Collection (0.3%), New Patient Calls (-8.4%), Exams (-11.6%), and Starts (-9.3%). The Net Collection number remaining positive tells us that existing patients were still able to pay, though we know even in the early stages of the pandemic many people were impacted economically.
OP: With two quarters of data available, how has the pandemic impacted practice health compared to 2019?
Moynihan: Orthodontics as an industry has been relatively resilient. It’s also been inspiring to see how our clients have adapted to new ways of working, leveraging their data to ensure they were following the numbers and using their previous year’s comparisons to benchmark where they should be, so they ultimately could make plans to stay healthy, get creative, and acclimate to the changing environment. We recently published a report with the AAO that represented Q2/Q3 (April-September 2020) that showed some trends for how the industry was performing.
Six to 10 weeks of shutdown created a backlog for many practices in May and early June, creating a lot of anomalies as we compare the same periods to any previous year. Now that we have October completed, we are able to see a clearer picture of how the year is shaping up with the last 5 months of data (June-October), and it’s showing trends toward growth. Across the key metrics, we see the following: Net Production (+11.1%), Net Collection (+2.2%), New Patient Calls (+2.5%), Exams (flat), Adult exams (+16.7%), Starts (+9.8%), and aligner starts (+21.4%).
Net Collections being positive instead of negative is very meaningful. It’s a lower percentage because we are still factoring in 6 to 10 weeks of lost production March-May in the year-to-date number. Several factors might be contributing to those significant increases in the adult exam and aligner category such as young, healthy adults having expendable income and spending more time online shopping, pent-up demand following the reopening, DTC companies raising awareness, and speculation about the impact of adults working from home and spending hours every week looking at themselves in Zoom meetings.
OP: What do you think accounts for the increases over 2019?
Moynihan: Pent up demand from patients that already called and came in from an exam prior to the pandemic, some families that remained employed have additional discretionary money to spend since things like travel and other leisure events have been limited during the pandemic, and as mentioned above the DTC online and “Zoom effect.”
OP: Now let’s talk about the data that orthodontists should keep an eye on. In what areas are practice numbers down compared to 2019? And is there an explanation for these numbers?
Moynihan: The five critical KPIs are where an orthodontist should start to better understand their practice. Drilling down deeper into the data vs 2019 (comparing June through October), there are two metrics that are down significantly versus 2019: child exams (-6.7%) and the ratio of new patient calls to exams (-10%, averaging 80% vs the target benchmark of 90%). For child exams to be below prior year, some parents may have had safety concerns about starting their kids in treatment this year or may have been concerned about finances with the pandemic’s uncertain impact on the economy. However, while child exams in June were negative, and July and August were flat, the numbers picked up in September and October. Since many schools were starting later than usual or perhaps staying completely remote, this changed the dynamics for the summer start season and opened flexibility for families to start treatment during the fall months.
When we examine the ratio of exams to new patient calls, ideally, the drop-off should not exceed 10%. At the 20% range and up, those numbers warrant close attention from practice owners. This means for every 100 people that call only 80 are actually coming in. It is not clear what is causing the issue, but it may be that some prospects decide against scheduling consultations due to safety concerns or it could be a number of other factors within the office, including schedule availability due to backlogs. We advise owners to make certain that everyone who calls is informed about how infection control is being addressed in your practice and explore options for virtual consultations should prospective patients want to minimize in-person visits.
OP: Conversion rates are up in Q3 compared to 2019. What are the numbers and what do you think is behind this? Has the pandemic changed consumer behavior?
Moynihan: There are a couple of drivers behind the increase in conversion rates. Orthodontists are incorporating virtual tools into their workflows and reporting that patients respond well to a virtual appointment option, for reasons of both safety and convenience. This opens up schedules to see more people and is at the discretion of the practice to even offer extended hours for virtual where a full staff is not required. Also, since many practices reopened, we have been hearing that people are less likely to be ‘shopping’ at the consultation stage. They are doing their research online in advance and may already be inclined to choose the practice with which they make a consultation appointment. Finally, during the pandemic the data tells us that those who pursue consultations may be more likely to be very serious about starting treatment.
OP: What does the data say about collections compared to 2019? Do you think these numbers will hold?
Moynihan: Year over year they are down slightly by -3.1%. Since the reopening we have recovered with a 5% swing and year to date they are +2.2%. It is inevitable that over the next 6 months the impact of the 6 to 10 week shutdown will have an impact on Net Collections due to the lost production over that period, especially since the lost time has not been made up on a year to date basis.
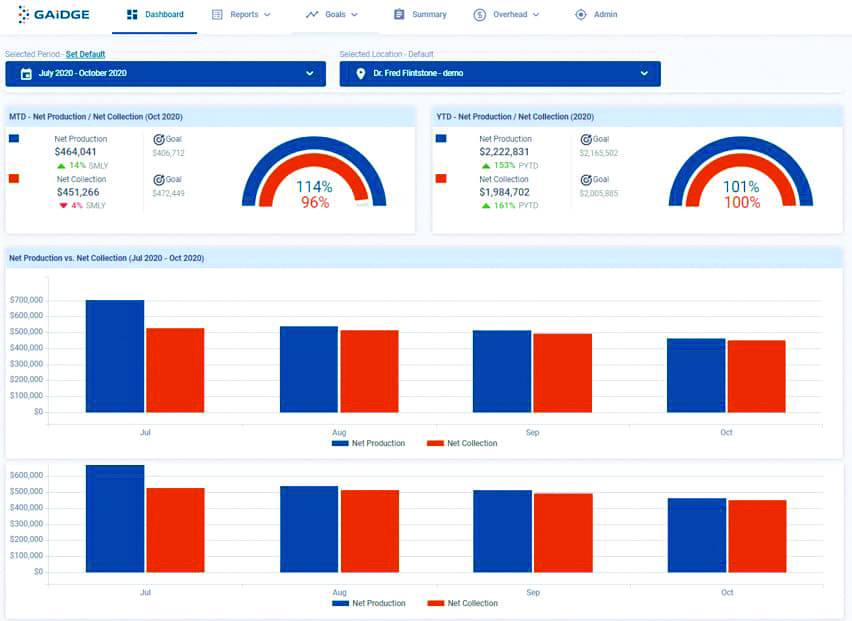
The Gaidge platform gives users a snapshot of their practice’s health.
OP: How have practice expenses changed in Q2 and Q3 compared to 2019? Were there new spending priorities during this period?
Moynihan: Gaidge is in the early stages of tracking practice expenses with the launch of our Overhead Expense Tracking Module where we integrate with the practice’s accounting system to automatically pull spending data. Having spoken with our industry partners, we have learned expenses increased due to requirements for PPE, separation of chair bays, and the like. Because of this, Gaidge’s Overhead Expense Tracker now includes separate line items for the Covid-19 related PPE and Equipment & Facility expenses so offices will be able to see how 2020 has impacted their bottom line.
OP: What’s the overall picture of how single-doctor practices under $1 million are weathering this year vs multiple-doctor practices with up to 10 locations? Is there a practice model that is doing better than the others?
Moynihan: When we compare the two practice models through Q3, both are very similar in their performance vs prior year. Of the five key metrics, only New Patient Calls for multiple doctor practices is trending much lower, down by -18.2% over prior year vs single doctor practices reporting declines of only -5.2%. This makes some sense as we think about larger practices having higher volumes to recover.
OP: These figures are looking at the impact of the pandemic on a national level. Are there regional trends Gaidge has identified?
Moynihan: Yes. Gaidge can segment the U.S. aggregate data by the AAO constituency regions as well. All Gaidge clients have access to anonymous aggregated data for their practices across the regions or the United States and can review it any time. When we look at the data for January through October 2020, three regions jump out as having been hit hardest in orthodontics: NESO, MASO, and PCSO. Observing the top five key metrics, we see declines YTD, ranging from -20% to -30% over prior year (PY). Comparing these areas to the heightened pandemic concentration, it correlates very well. The RMSO has performed the best across the U.S. It showed flat starts, with the only major decline in New Patients added. It would be speculation to make assessments on the reason this region hasn’t been hit as hard, but cultural attitudes may be a factor as well as population and smaller communities not experiencing the same levels of pandemic outbreak.
OP: With the pandemic, practices pivoted to incorporate virtual technology to connect with new patients and maintain continuity of care with existing patients. In the summer, Gaidge introduced a new update that tracks virtual consultations and observation checks. It’s too soon to report data, but what can users expect from this tool?
Moynihan: Yes, we are looking forward to seeing how this data begins trending. With it being a new addition to Gaidge, we are in the early stages of mapping our clients’ data and really being able to report on trends. We saw the explosion of virtual appointments as the pandemic required offices to close, but we know the uptake of the technology is still occurring. We invite all of our clients using virtual to call us and take advantage of this feature in Gaidge. It only takes a few minutes to set up. The value of understanding the impact of virtual is yet to be measured and we are eager to be on the forefront of gathering these insights.
OP: At the end of September, Gaidge rolled out its new Executive Member Program. How does this program benefit orthodontists and how can it help them as they weather the pandemic?
Moynihan: This program provides practice owners with the most robust version of Gaidge that includes all of the operational metrics plus two new financial modules and access to experienced practice consultants from our sister company, Impact360. The addition of these tools that include the Overhead Expense Track and Practice Projections, plus the consultancy with the Gaidge platform, is like having an automated business analyst and personal coach, who is not only producing daily information on the metrics orthodontists are regularly thinking about, like starts and production, but is also looking at where the money is going, what results are we yielding and helping plan very specifically to achieve future business goals. I can’t think of a more important time to have a pulse on the business numbers and using data to make decisions for the future. Resilient businesses understand what’s happening and they ensure they use reliable information to pivot early and quickly to stay ahead.
OP: As practices close out the year, what data should they have an eye on to make sure they close out strong? And what should be front of mind for 2021?
Moynihan: At Gaidge, we often discuss the basic business model for orthodontics with what we term the Consumer Conversion Waterfall. This measures how effectively a practice is taking a new patient call and converting it to a start, which drives production. As practices think about their businesses using this basic model, it is imperative to begin with a strong, targeted, tactical marketing plan to drive patients to call the practice. Once they have initiated contact, it is critical to monitor the patient experience through the exam. The new call to start ratio is where we see many patients falling out of the sales funnel, costing practices hundreds of thousands of dollars. Monitoring new patient calls to exams to starts is the backbone of any orthodontic practice, but every business should be looking at their critical KPIs as compared to prior year and also planning for the coming year. Using our five key metrics, practices need to understand how 2020 has impacted them and of course do their annual review with their accountant to evaluate the health of the business. Importantly, practices should create a plan for 2021. Whether that includes the automation of Gaidge or another method, we advise creating metrics to strive for and bringing the team in to align on monthly, quarterly, and annual goals. OP