
![]()
Q: Flexible financing can boost starts short term, but how sustainable is that?
A: Great question, and really one that relates to any revenue-stimulating strategy you take on. How do you evaluate the impact? OrthoFi has been tracking the production and growth data of our practices (nearly 300 to date) since its launch in 2014, so we have industry-best data on how flexible open-choice terms can impact a practice over time. Here are some results for the nearly 100 practices who have a full 3 years of metrics with OrthoFi:
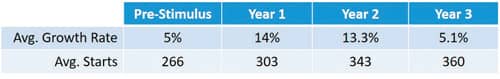
This shows the average growth of these practices before they started with OrthoFi (Pre-Stimulus), and the 3 years following. As you can see, the first year shows a dramatic surge in average starts growth of 14% (roughly five times the published market growth rate). That growth rate is mostly sustained in the second year. Reasons for that are a combination of continued positive impact on conversion rate as the practice’s pending and observation patient population continues to feed in over the course of a 24-month period, as well as the commonly reported uplift to referrals once patients see how affordable and easy the process can be. Then, in Year 3, it does show a slowing of the growth rate to 5%, which is still over 60% higher than average market growth, but more in line with the original growth path. Some practice owners might look at that and say, “It stopped working after 2 years.” That seems like the simple conclusion, but in fact that’s wrong. The truth is that assuming a stable population during that time, the practice has grown and maintained a higher market share with a higher level of starts. This chart below shows what I mean.
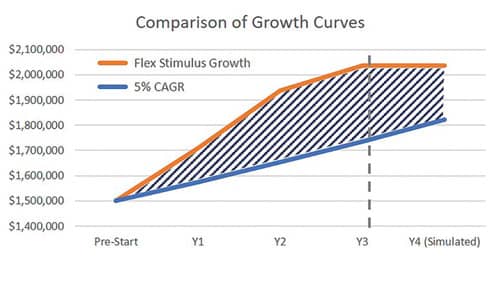
If you compare the production performance of the average practice compared to a practice that maintained the original 5% growth rate, you can see the flattening of the Flex Stimulus curve, but as you can see, the important area of the chart is the shaded region which shows the total amount of added production realized in that period. To hammer that point home, even though we don’t have 4 years of actual data, this chart simulates a scenario where the top practice shows zero growth in year 4 compared to a sustained 5% growth (although 5% growth is not guaranteed in a market averaging 2% to 3% growth annually). Even then, the total revenue is still more. The entire shaded region is the ROI. When you consider that the growth came in at a higher Variable Contribution Margin [see previous Inside the Numbers articles], the total impact for this practice over 4 years would be an added $931,000 in production and over $670,000 in estimated net profit. Therefore, to judge the impact of flexible financing or any growth-generating strategy, don’t get caught up with focusing on the percentages. If something you do can stimulate a jump in market share and even maintain that share, consider that a huge success. Remember: At the end of the day, you take home dollars, not percentages. OP
About Inside the Numbers: Answers to questions submitted to Inside the Numbers are based on data collected by OrthoFi™, and presented by CEO David Ternan. The data pulls from over 200,000 patient starts in almost 300 practices, including patient demographics and preferences, risk profile, and payment performance on over $270 million in receivables. Inside the Numbers aims to help you make informed decisions about patient financing and to dispel myths that can hinder growth.
Submit your questions to Inside the Numbers at [email protected].