![]()
Q: I’ve started offering flexible terms and seen great growth from that, but my rate of collections to production has dropped. Is flexibility hurting my collections?
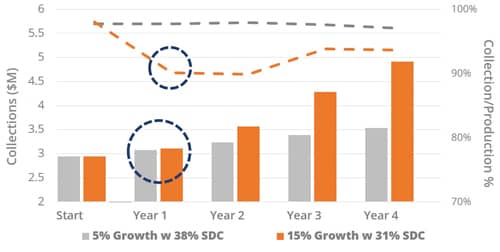
A: In a word: No. Although I can’t see your numbers, your drop in conversion-to-production ratio is likely a natural result of your growth. Many practice owners are taught or conditioned by their peer groups to regard this magic ratio as the ultimate barometer of business management, and that they should aim for the sacred target of 97-99%. What they often don’t understand is that those norms are built on a foundation of assumptions that either are outdated or may not fit their situation. See the chart above (click on the chart to enlarge).
This charts two identical 600-start practices with identical collection effectiveness (98.5%) and the impact of growth over time. The first (grey) is growing at 5% annually with a more conventional fee model of 20% pay-in-fulls and 20% down payment, which is represented as 38% Same-Day Cash (SDC). SDC is simply a ratio of the combination of pay-in-fulls and down payments to overall production. The second practice (orange) is growing annually at a 15% rate due to a more flexible open choice offering like those we work with at OrthoFi, with an average of 22% pay-in-fulls and 15% average down payment and SDC of 31%. The bar chart (left axis) tracks their overall annual collections, and the line graph (right axis) charts their ratio of collection to production. As you can see, the faster growing practice sees far greater overall collections over time, but in the first year collections are virtually flat. This is due to the fact that the bulk of orthodontic revenue is deferred, yielding an increase in AR and compounded collections in the out years. The other natural outcome is that the ratio of collections to production drops significantly in year 1 versus the relatively steady 98% rate of the 5% growth practice, and although it converges over time, will never return to that 98% rate of the 5% growth practice. As I said, there is ZERO difference in their collection effectiveness on collectible AR. So what this uncovers is that the 97-99% target is based on the assumption of the steady 4-6% growth that this industry had experienced for decades prior to the 2008 economic crisis. Today, not only is 4-6% growth not an entitlement (overall market growth is reported at 2.5-3%), but these norms undermine the potential of practices to gain market share and significantly outpace market rate. Our practices see an average 14-15% annual growth, and often see a similar trend in their rates as above. It’s not a bad thing at all. In fact, I think most readers out there would choose the orange practice if they understood this dynamic. Not only will the initial investment yield more income, but the growth in AR also increases their practice valuation. Growth mindset is a different paradigm, and cannot be measured or evaluated with conventional metric norms. Stay the course. OP
About Inside the Numbers: Answers to questions submitted to Inside the Numbers are based on data collected by OrthoFi™, and presented by CEO David Ternan. The data pulls from 200,000+ consults and over 150,000 patient starts in over 200 practices, including patient demographics and preferences, risk profile, and payment performance on over $150 million in receivables. Inside the Numbers aims to help you make informed decisions about patient financing and to dispel myths that can hinder growth.
Submit your questions to Inside the Numbers at [email protected].