![]()
Q: Everyone is getting more flexible—is there a limit?
A: In the 4 years since we launched the first payment slider to the industry and started sharing data on flexibility, we’ve seen more and more practices adopting flexible financing. With the dynamic trends shaping the market (ie, rapid consolidation, DSO expansion, direct-to-consumer threats), it’s the right thing to do. However, data shows that there is a benefit to Smart Flexibility—to maintaining guiding principles for balanced growth and maximum ROI.
To date, we’ve started over 250,000 patients in our partner practices, and we’ve managed and tracked over 150,000 payment plans. It is irrefutable that lower downs and longer payment options increase production and start volume, but are all loans the same? Although we disagree with industry-recognized ‘methods’ that sharply raise obstacles of 30% to 50% down and shorten payment periods for B, C, and D patients, there does need to be some discipline. Some practices have swung the needle to the far extreme, and are now skipping credit checks and offering $99 down, $99/month offers across the board to stimulate growth. Growth will come from that, but also thinner cash flow and an undue bulge in default risk and operations workload for their teams in 3 to 4 years, when the traditional 30-60-90 or ‘when they come in’ follow-up collection protocols have long broken down.
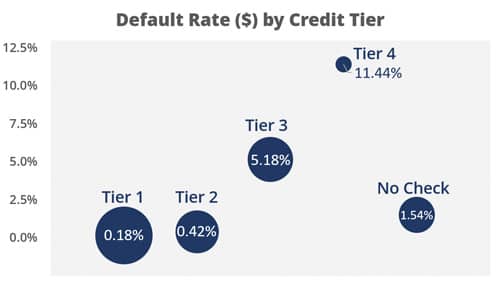
Take a look: The chart shows default rate on mature plans by credit tier (1 = highest, 4 = lowest, plus those who elect not to provide credit information). Bubble size reflects the relative size of that population in our mix of plans. As expected, default tracks by tier, but the separation with tiers 3 and 4 should tell you two things: One, you need credit information via soft credit check to help you assess risk; two, lower tiers need a different approach. That doesn’t mean you should turn away these patients or price them out of your practice. Our philosophy is everyone gets a plan, everyone gets open choice—because the vast majority of even high-risk patients pay for their treatment. [See past articles on open choice and how it creates leverage to balance cash flow with growth.] That said, you should temper the options with slightly higher down payments (we shift minimums from $250 to $750 or $1,000 but stop there due to severe impact to conversion rate). We also introduce low-level interest for any extended plans, with slightly higher APR for lower tiers (6.9% vs 4.9%) and deliver a 180-day protocol with 21 touches in the first 90 days. This is designed to counter the incremental risk of these loans, while still allowing the practice to enjoy the growth potential from the majority who will pay. Like big businesses, we manage risk with a portfolio approach. Overall, our default rate is at 1.92% for these plans, well within industry standards, plus our practices enjoy a portion of the interest earned to reduce the impact even further. Get the maximum benefit, but use systems to manage the risk. That’s smart. OP
About Inside the Numbers: Answers to questions submitted to Inside the Numbers are based on data collected by OrthoFi™, and presented by CEO David Ternan. The data pulls from 200,000+ consults and over 150,000 patient starts in over 200 practices, including patient demographics and preferences, risk profile, and payment performance on over $150 million in receivables. Inside the Numbers aims to help you make informed decisions about patient financing and to dispel myths that can hinder growth.
Submit your questions to Inside the Numbers at [email protected].