Practice performance improved in 2024, but labor constraints and economic volatility could slow further progress
By Roger P. Levin, DDS
We have good news to report this year! The trends and practice performance indicators in orthodontics are pointing in a positive direction for the first time since the COVID-19 pandemic. This is great news for orthodontic practices that have been affected by negative economic factors such as higher staff compensation, increased overhead due to inflation, and fee competition. This year’s survey indicates that orthodontic practices are moving in the right direction and that any orthodontic practice has an opportunity to improve overall performance.
Survey Demographics and Practice Characteristics
The data for this year‘s Orthodontic Products Levin Group Annual Practice Survey was collected in February 2025 from a random sample of practicing orthodontists who were asked to consider their practice results for the full 2024 calendar year.
The findings and trends identified in this survey primarily reflect the conditions being experienced by orthodontists in private practice. Ninety-two percent of the respondents are in some form of private practice. The remainder worked in a Dental or Orthodontic Service Organization (DSO or OSO) practice model.
The average age of this year’s respondents is 54 years. Furthermore, 68% are male and 32% are female, a ratio that is representative of the profession at large as compared to the current membership of the American Association of Orthodontists.1 Interestingly, the percentage of female respondents has increased in each of the past 4 years which is consistent with the growing percentage of female dental school graduates, which stands at 54.5% according to the American Dental Association.2
Of respondents, 63% are in solo practice, 24% reported they practice with another orthodontist (for a total of two doctors in the practice), 9% have three orthodontists in the practice, and 4% have four or more. This clearly indicates that orthodontics is still primarily a profession of solo practitioners. Unlike other types of dental practices, orthodontic practices are volume-based and can achieve high production levels, even for a solo orthodontist. This situation is not expected to change rapidly or radically in the future. If anything, we should expect a slight increase in the number of solo practicing orthodontists given that technological improvements that result in longer intervals between patient visits (and therefore more chairtime capacity) will allow every orthodontist to consult with, start, and monitor more patients in less time.
LISTEN TO THE PODCAST: Dr Roger Levin on Future-Proofing Your Practice in a Shifting Economy: Key Takeaways from the 2024 Practice Performance Survey
Production Trends Show Positive Momentum
Anyone who has heard me speak or read my articles is familiar with my strong conviction that the single most important factor in the success of any orthodontic practice is production. An orthodontic practice with average or above production will create a successful financial career and professionally satisfying environment for most orthodontists. This year orthodontic practice production went up 3.5% for orthodontists taking our survey. They reported an average production per doctor in 2024 of $1,588,744. While a 3.5% increase is not a “juggernaut level” production boom, it is a significant improvement over the past several years and an 8.2% swing in the positive direction from the previous year’s number.
Factors Behind the Increase in Production
As expected then, many more orthodontists reported production increases than decreases. Sixty percent reported an increase, 35% a decrease. And it is notable that only a very low percentage (5%) reported declines of 10% or more. This positive production news could be due to several factors.
First, the overall economy was stable in 2024. It is important for orthodontists to take note that should the overall economy decline or stock market values decrease, there will be a direct correlation to the number of patients who will forgo orthodontic treatment. Evidence of this was seen in the 2007–2008 Great Recession where orthodontic practice production decreased by 10% according to Levin Group data and surveys.
Second, orthodontists may have increased practice efficiency in response to several years of either flat or declining production. In addition, overall insurance reimbursements were flat or declined and fee increases were low. With the unprecedented overhead increases of the past 5 years, many orthodontists realized that steps and actions were needed to improve overall production, which may be reflected in this survey.
Third, staff efficiency may have improved. Many orthodontic practices were seeking additional staff members, and in the interim learned to operate much more efficiently with one or more fewer staff members.
Any or all of these factors may have contributed to an increase in practice production, and we were delighted to see that it rose by 3.5%.
Production Differences by Market Size
More insight can be gained by viewing production statistics broken out by market size.
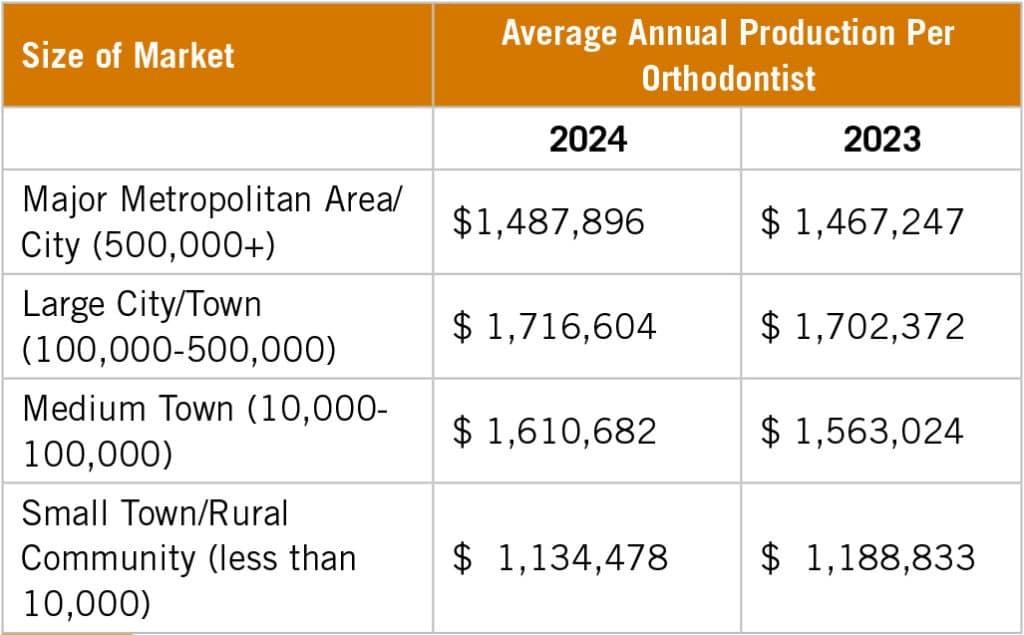
It is extremely interesting to note that the larger population areas did not have the highest practice production. For example, Large City/Towns had approximately $250,000 higher production per doctor than the larger Major Metropolitan population areas. That may be due to the higher concentration of orthodontists in larger metropolitan areas creating more competition and downward pressure on fees.
And again, as was noted last year, orthodontists practicing in small communities saw production levels that were 25-30% lower than their counterparts in larger communities.
And there is more good news on the production front. Of orthodontists responding to the survey, 91% were optimistic that they will see an increase in production in 2025. It is important to recognize that orthodontics is what is referred to as economically elastic. This economic term simply means that orthodontics is like jewelry or luxury products. When the economy is good, more jewelry and luxury products are sold, and when the economy is not good, less is purchased. Orthodontics has followed a similar pattern over time where a declining economy does decrease the number of orthodontic cases in that particular timespan. No one knows where the U.S. economy is headed, but there may be some variance going forward.
Profit Growth Reflects Improved Efficiency
We are pleased to report more good news. Fifty-nine percent of orthodontists reported an increase in profit in 2024 versus 33% reporting a decrease. This is a 9% swing in a positive direction from last year’s survey. The orthodontists responding to the survey reported an average profit increase of 3.3%, very commensurate with the reported production increases.
While production is the single most important factor in the success of an orthodontic practice (as stated earlier), profit is the ultimate indicator of practice performance. Many of us focus on production because it is easy to analyze on a daily, weekly, monthly, and annual basis. But, as we often say at Levin Group, you can’t spend production. You can spend (or save) profit though. Profit is the true indicator of practice financial health.
As an example, consider the practice where production goes up 5% but overhead goes up 7%. That practice decreased in profit by 2% which would not be good news. However, this year, with a profit increase of 3.3% and a production increase of 3.5%, production outpaced any increases in overhead and that is good news!
Overhead Still a Concern, but Improving
The average orthodontic practice in 2024 reported an overhead of 55.5%. In simple financial terms that indicates a 44.5% net profit. Those numbers are two points better than last year.
This year, fewer practices (58%) ranked rising overhead as their number one challenge today. That’s down from 61% last year, which is a 3% improvement in identifying overhead as the number one challenge. Coupled with the production increases, this would indicate that in orthodontics the overhead situation is generally improving and if the economy remains stable we would expect to see improvement again in 2025.
Patient Volume and Referral Sources
There is a strong demand for orthodontic services. Of orthodontic practices participating, 64% reported the same or higher total patient volume in 2024 and 63% reported the same or higher new patient volume.
Where are these new patients coming from?
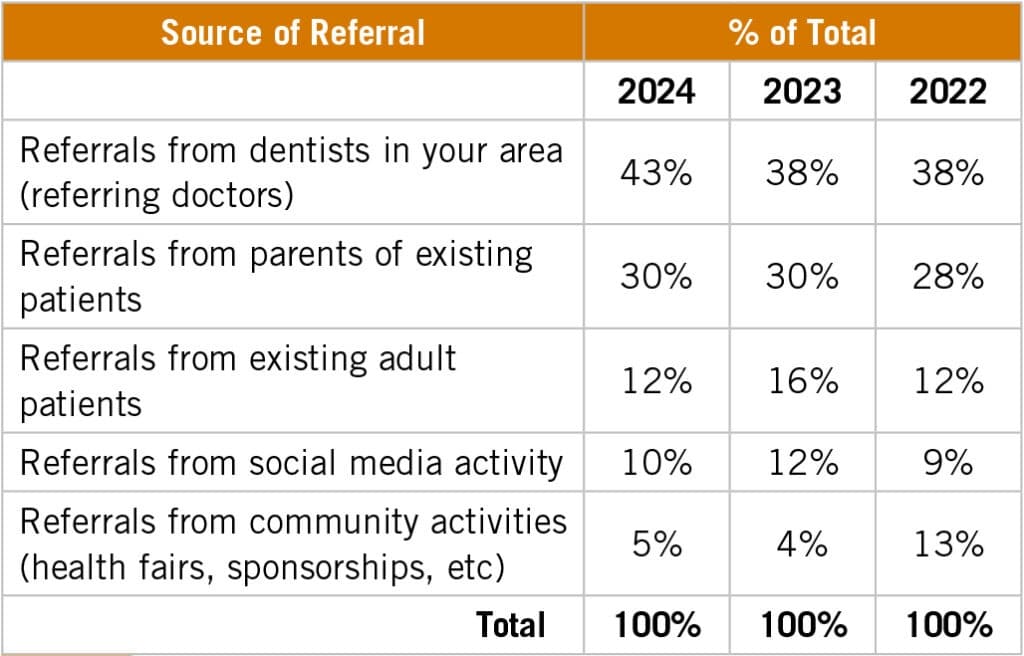
As you can see in Figure 2, in 2024 there was a significant increase in the percentage of patients that arrived in orthodontic practices being referred by a general dentist. Why would orthodontic practices be noting higher referrals from dentists in the area? It is likely that after several years of decreased or flat production, orthodontists have been reaching out to referring dentists with a more structured relationship marketing approach. By Levin Group’s calculations, more than $3.6 billion in revenue is referred by general dentists to orthodontic practices every year. Almost all general dentists refer out some amount of orthodontic treatment, and it seems that more orthodontists in our survey are beginning to recognize the benefits of intentionally marketing to their referral base.
As has been the case for several years, 30% of referrals came from parents of existing patients, 12% from adult patients, 10% from social media, and 5% from the community at large.
A quick aside about referrals from adult patients. Since the advent of aligners, many orthodontists overlook the production potential held by getting more referrals from their adult patients. And if an orthodontist is interested in getting more adult patients, the general dentists in their area are a great source. Consider creating specific marketing strategies to your referring dentist for their adult orthodontic patients. The more adult patients you have, the more opportunity for them to also then refer their spouses, coworkers, and friends.
Treatment Fees and Remote Monitoring Trends
Orthodontists appear not to have increased fees by any significant amount in 2024. Our survey indicated that the average fee for a bracket and wire case was $6,121 and for clear aligners the average fee was $6,373, both basically unchanged from 2023.
Although it is not particularly relevant, we always enjoy reporting the highest and lowest fees reported in the survey.
| For Bracket and Wire | For Clear Aligner | |
| High | $10, 850 | $11,400 |
| Low | $3,000 | $4,200 |
The average number of total annual starts per orthodontist in our survey this year was unchanged from the prior year, standing at 287.

But the changes in intervals between in-person scheduled patient appointments are really interesting and important.

It is generally recognized that the interval for patient visits is going to expand. The only question is when, by how much. For both types of treatment, practices are seeing patients in-person less frequently when employing some form of remote monitoring. The longest reported interval for aligner cases using remote monitoring was 40 weeks, and many practices reported seeing patients every 24 weeks.
Thirty percent of this year’s respondents reported using some form of remote monitoring in their practice in 2024 for the following purposes:

Of those that reported using remote monitoring, their choice of platform is shown below.
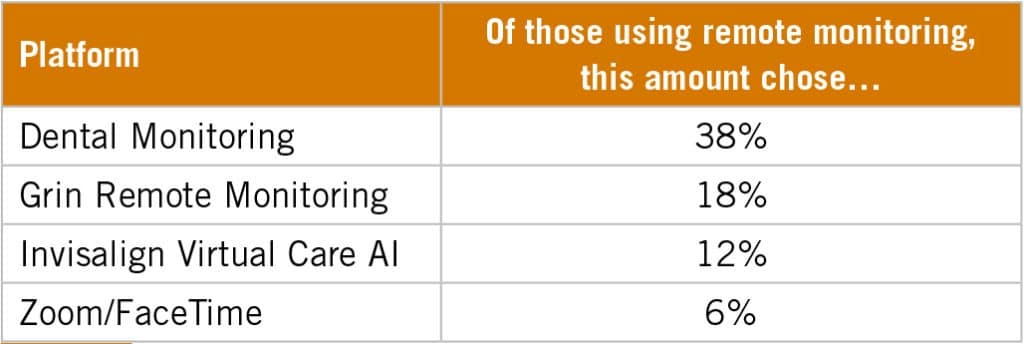
We expect remote monitoring usage to increase on a steady basis and will begin studying this more closely in the 2025 survey. We are still in the early adopter stage where forward-thinking orthodontic practices are beginning to convert to a practice model based on remote monitoring. Remote monitoring creates an opportunity to see patients less frequently and therefore more practices will quickly become comfortable with remote monitoring, allowing longer appointment intervals while maintaining excellent quality and patient satisfaction. Stay tuned, we will have more on this next year.
Orthodontist Outlook for 2025 and Beyond
More good news. The orthodontists responding to this survey were extremely optimistic about the future. Ninety-three percent are confident that they will maintain a successful orthodontic practice not just next year, but for the next 5 years. When asked specifically about their expectations for production in 2025, only 8.5% expected to decline this year.
While there may be many reasons for a doctor to expect lower production (imminent retirement, new competition entering the market, localized economic challenges, etc), the fact that such a small number of orthodontists expect a production decline means there is huge optimism.
Key Challenges Still Impacting Practices
However, there are challenges.
Every year we ask orthodontists to rank eight challenges in priority order.
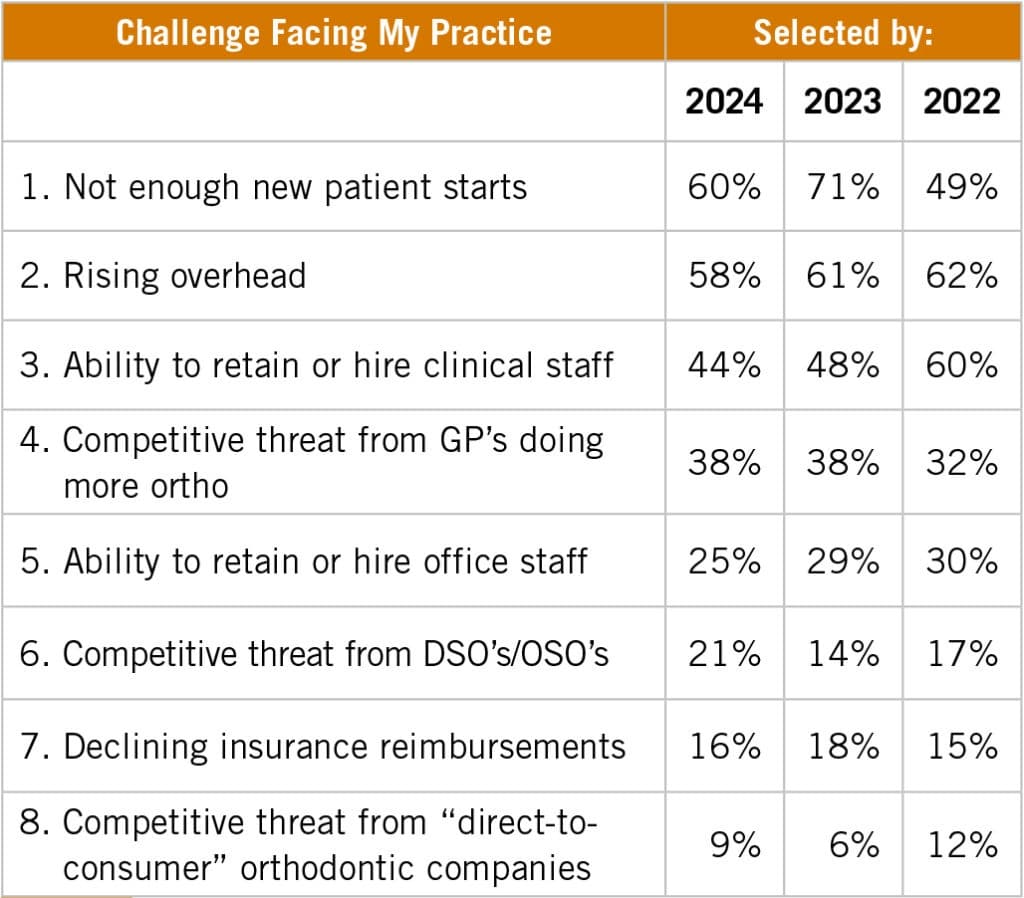
Not enough new patients took the top spot in the challenge awards this year. Overhead and staffing are still near the top, but it is also interesting to see how much more concern is present amongst the group over threats from DSOs and OSOs.
Staffing Shortages Continue to Pose Obstacles
Staffing challenges are still impeding progress, but things seem to be moving in a good direction. Dentistry is not the only industry struggling with attracting and retaining labor. More than 74% of respondents still believe there is a shortage of orthodontic staff available. This is an improvement over the 81% who felt this way in last year’s survey, but if three-quarters of orthodontists believe there is a shortage of team members available, we remain in crisis mode.
Here is more evidence of that. Only one in eight practices reported “we are not experiencing any staffing challenges right now.” Of responding orthodontic practices, 52% are currently seeking to hire at least one staff member. And because those practices are also reporting position vacancies, these new hires are not growth-related but reflect an attempt to simply maintain what is needed to operate the practice.
Not including orthodontist compensation, 82% of practices are paying higher total compensation for each job position now than in the prior year—7.1% more. The trend of escalating staff labor costs continues. Not surprisingly, no practice in the survey reported reducing team compensation levels last year.
Retention Strategies and Leadership in Focus
When asked what they are doing to address current staffing challenges, respondents chose:
- Increasing base compensation for staff (selected by 56%)
- Providing more bonuses for staff (selected by 37%)
- Offering more/better employee benefits (selected by 23%)
- Adding technology for productivity enhancement—automated reminders, etc (selected by 42%)
In the face of this unprecedented staffing situation, orthodontists need to focus on improving their leadership skills with the team. The best way to replace team members is not to lose them. Many new team members do not enter their jobs with as much skill today as in the past, requiring better leadership and training going forward. By keeping your team in place, accentuating their strengths, and adding to their skill sets, orthodontists will have the best labor picture possible in today’s environment. Outstanding teams perform better, and this will become increasingly important as this staff shortage continues.
Final Takeaways and Appreciation
First, a big thank you to everyone who took the time to complete this year’s Orthodontic Products Levin Group Annual Practice Survey. It helps everyone in our profession understand what is happening and keeps us all well informed about the state of orthodontic practice in the United States.
Overall, the news is extremely positive. Production is higher. Profit is up. A few fewer practices are struggling to find team members. Overhead is stable and a steady stream of patients continue to come in for treatment. There were challenges, as is always the case in business, but overall, we were delighted with this year’s survey results and expect the positive trends to continue (if the economy remains stable). This is great news for all of you. OP
References:
- American Association of Orthodontists. AAO By The Numbers. Published March 2025. https://www2.aaoinfo.org/membership/member-data
- American Dental Association Health Policy Institute. Dental School Grads and Advanced Program Enrollment by Gender, 2023-2024. https://www.ada.org/-/media/project/ada-organization/ada/ada-org/files/resources/research/hpi/dental_school_grads_gender_2023-24.pdf
Photo: ID 345935051 @ Andrii Zorii | Dreamstime.com

Roger P. Levin, DDS, is the CEO and founder of Levin Group, a leading practice management consulting firm that has worked with over 30,000 practices to increase production. A recognized expert on orthodontic practice management and marketing, he has written 67 books and over 4,000 articles and regularly presents seminars in the U.S. and around the world. To contact Levin or to join the 40,000 dental professionals who receive his Practice Production Tip of the Day, visit levingroup.com or email [email protected].


