by Carroll-Ann Trotman, BDS, MA, MS, and Lucia Cevidanes, DDS, PhD
Advanced imaging is helping orthodontists understand facial aesthetics
 |
 |
At the University of North Carolina (UNC) Department of Orthodontics, 3-D facial soft-tissue and hard-tissue analyses are being conducted as part of National Institute of Dental and Craniofacial Research (NIDCR)-funded clinical trials on patients with craniofacial (DE13814) and dentofacial deformities (DE05215). These trials require global facial analyses and the applications of novel approaches for 3-D imaging, as well as creative methods of analysis. Advancements in computerized technology that allow the manipulation of large data sets have set the stage for these applications. In the discussion that follows, we will describe the 3-D methodologies and analyses currently used at UNC for facial imaging.
Facial Soft-Tissue Movement
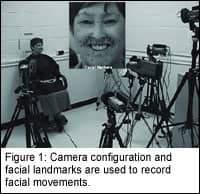
The UNC craniofacial database is the only one in the world that has extensive measures of 3-D facial soft-tissue movement and morphology, with at least 1-year follow-up data, on nearly 60 patients with cleft lip and palate, 20 patients with dentofacial deformities, and more than 70 noncleft “control” subjects. The technology employed to assess dynamic facial movements of these subjects1,2 is a motion-analysis video-based tracking system. Small, 2 mm- to 4-mm diameter, retro-reflective markers are tacked to specific landmarks on the face. For the patients with a cleft lip, these markers are concentrated around the nasolabial region (Figure 1, inset). The patients are instructed to make maximal facial animations. During each animation, four analog video cameras with a 25-mm focal length sample the positions of the markers at 60Hz (Figure 1).
To compute 3-D coordinate data, only two cameras are required to record the marker positions in space; but because we want to ensure that data are recorded for all facial markers, two additional cameras are used. The recorded sequential images are digitized in real time and are then stored on a hard disk for subsequent off-line processing. The data obtained are voluminous. For example, a particular animation (say, a smile) is tracked for 3 seconds. If a subject has 40 markers tacked to the face, which is often the case, then the result obtained by recording a single animation at 60 Hz is 180 frames of 3-D data on 40 markers per frame. Subjects may be instructed to perform up to seven animations, each repeated five to seven times.
This data may be processed in different ways. Currently, we obtain maximum or border positions measured at the extreme stages of an animation, as well as measures of movement kinematics that encompass the entire animation.
Maximum/Border Positions
 Border positions are characterized by computing the maximum distance that a marker or landmark travels from rest as well as the resultant vector. Because head motion of the subjects during recording of animations confounds these absolute measurements, statistical approaches are used to eliminate head motion. The results of previously published data on patients with cleft lip and palate are presented here to demonstrate the use of border movements.3 In this instance, head motion is controlled by a modified Procrustes Fit.
Then, the maximum 3-D displacement of four repaired unilateral cleft patients, five repaired bilateral cleft patients, and 50 noncleft subjects were analyzed during four animations: cheek puff, smile, lip purse, and grimace. On average, maximum facial-tissue displacements for different facial landmarks were less in cleft than normal subjects; however, some cleft patients clearly exhibited greater than normal “compensatory” movements. For example, impairment in upper-lip movement during the smile animation was accompanied by exaggerated movements of the lower lip. There was greater right-left asymmetry in movement in the cleft subjects than in the normal subjects.
Movement Kinematics
The distance between any two markers during an animation describes a function over time, or a curve. The curves can be analyzed using statistical techniques known as functional data analysis.4 This approach to the measurement of movement is independent of head motion, and is a true dynamic analysis of the entire movement. Mean movements are calculated, and this requires alignment of these curves to account for problems such as the timing of the animations.
For example, one person may perform the movement quickly, and another may do it slowly, so the movements must be synchronized for time. Using this analytical approach, we demonstrated significant changes between the presurgical and postsurgical facial movements of orthognathic surgery patients with different facial types, as well as differences in the presurgical movements among the different facial types, but no postsurgical differences.5 These findings suggest that the restoration of normal hard-tissue proportion achieved with orthognathic surgery may normalize facial movement. The statistical analyses were based on principal component scores that described the main differences in the direction of movement during a particular animation. These mean comparisons are best viewed during the dynamics of the movement5 (also see the Web site www.stat.lsa.umich.edu/~faraway/face/).
Facial Form at Rest
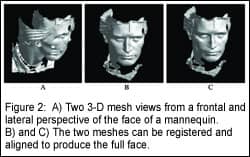
Soft-tissue analysis would not be complete without a measure of soft-tissue facial form at rest. At UNC, we use a 3-D camera system to capture facial soft-tissue images of subjects. Three-dimensional images of the face (Figure 2, page 52) are produced from the 2-D images by correlating specific points on the 2-D image with the corresponding points on the 3-D image. In a recent study,6 the accuracy of the camera system was evaluated, and an approach to compare images was presented.
Facial Hard-Tissue Assessment
 The UNC Dentofacial Program database contains more than 3,000 patients with initial records and more than 1,400 with at least 1-year follow-up data. A great deal of research utilizing 2-D cephalograms has made it clear that there are major differences in stability and predictability of various orthognathic surgeries. Long-term stability studies carried out by Proffit, Bailey, and Phillips have shown that maxillary-advancement surgery is more stable than two jaw procedures.7 Assessment of the transverse rotation of the condyles that accompanies ramus surgery, and condylar remodeling after orthognathic surgery, is clearly a 3-D problem. The correction of maxillo-mandibular skeletal discrepancies requires teeth and jaws to be manipulated in three dimensions. Preliminary results utilizing new computer graphics image-analysis of the CT data are very promising.
 Cone-beam CT (CBCT) scanners render high-resolution images with lower doses of radiation than spiral CT.8 For this reason, 3-D CBCT is the method of choice in evaluating the complex dentofacial structures. While cross-sectional cuts in lateral, axial, and antero-posterior planes permit access to the internal morphology of soft tissues and skeletal structures, the localization and relationship among various facial components can be difficult to interpret. The 3-D modeling of the anatomical structures can facilitate this interpretation.
Various techniques for reconstruction of 3-D CT images have been used in diagnosis, treatment planning, and simulation. Our imaging protocol involves a 36s head cone-beam CT scanning with a field of view of 12 in x 12 in. Primary reconstruction of 360° projections uses filtered back-projection techniques to build the 3-D data volume in a method similar to conventional CT.9 After completion of the primary reconstruction, the maximum spatial image resolution is 0.2 mm–0.4 mm.
Construction of 3-D Models and Segmentation With Insight-SNAP
 An interactive image-segmentation program is used for segmentation of the cranial base and mandible.10 Image segmentation refers to a process of examining cross-sections of a volumetric data set and outlining the shape of structures visible in these cross-sections. A key feature of SNAP is the ability to segment and navigate through the volumetric data set in any of the orthogonal slice windows (sagittal, coronal, and axial views) with a linked cursor system that allows tracking of a single voxel. SNAP allows regional, semiautomatic segmentation employing user-initialized deformable implicit surfaces that automatically evolve to the most appropriate border between neighboring anatomical structures.
After the segmentation, a 3-D graphical rendering of the volumetric object allows navigation between voxels in the volumetric image and the 3-D graphics with zooming, rotating, and panning.
Registration and Superimposition to Assess Changes
 CT images and 3-D models before and after surgery are registered on the cranial base surface, as the cranial base structures are not altered by surgery—unlike the maxilla and/or mandible. The fully automated registration is computed by the MIRIT software.11
MIRIT computes the rigid registration (translation and rotation) that optimally aligns the preoperative and postoperative data set with subvoxel accuracy at the cranial base (Figure 3, page 52). The computed registration is then applied to the segmented structures to measure mandibular rami alterations.
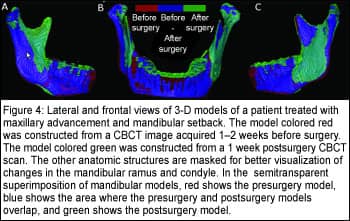
A new tool for comparison of 3-D models is used for visual and quantitative assessment of the location and magnitude of segmentation differences via graphical overlays and 3-D displays12 (Figures 4 and 5). Inputs to this software are the registered presurgery and postsurgery segmented models of a patient’s mandibular rami.
Quantitative evaluation includes intraclass correlation of the resulting volumes and shape distance metrics such as the mean absolute distance between the segmentations. These volumetric and shape measures are then calculated for the full 3-D segmentations.
A 3-D graphical display of the structure is color-coded with the regional magnitude of the displacement between the presurgery and postsurgery segmentations (Figure 2, page 52). The preoperative or postoperative image data segmentation results are overlaid for comparison (Figure 4).
The direction of 3-D displacement varies at different surfaces at the right or left sides of the face. For this reason, color maps indicate inward (blue) or outward (red) displacement between presurgery and postsurgery segmentations.
In the medial surfaces of the mandible, a blue color code indicates an inward displacement of that surface after surgery, meaning that the displacement occurred in a lateral direction. This lateral displacement is depicted by the red color in the lateral surfaces of the rami, indicating the outward (lateral) direction of displacement, and vice versa. If there was a medial displacement of the condyles and rami with surgery, the medial surfaces would be coded red and the lateral surfaces would be coded blue.
For anterior surfaces, an inward blue color code indicates posterior displacement (setback).This posterior displacement is shown at the posterior surfaces in red (outward displacement). Forward displacement (advancement) is shown in red in the anterior surfaces (outward), and blue in the posterior surfaces (inward). Absence of surgical displacement is indicated by the color green (meaning there was 0-mm displacement).
VALMET computes several cumulative measures of the surface distances between presurgery and postsurgery models. The most relevant of these measures, the mean surface distance, quantifies how much, on average, the two surfaces actually differ from each other.
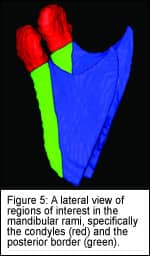
The mandibular rami models of presurgery and postsurgery images are also analyzed for specific regions of interest: the condyles and the posterior border of the rami (Figure 5).
The definition of the region of interest is performed in SNAP, using combined presegmentation and postsegmentation models to ensure that the regions of interest would be comparable.
The posterior border region of interest is defined by a plane tangent to the anterior contour of the condyles and parallel to the posterior border of the rami.
The inferior limit of the condylar region of interest is defined by the interface of the posterior border cut. After cutting, each region of interest is analyzed separately in VALMET. Surface distances are not computed separately for any of the rami anatomic structures anterior to the posterior border because these included the areas of the sagittal split osteotomies.
Carroll-Ann Trotman, BDS, MA, MS, is an associate professor of orthodontics and interim dean for academic affairs at the UNC-Chapel Hill School of Dentistry. She can be reached at [email protected].
Lucia Cevidanes, DDS, PhD, is a postdoctoral research fellow in the UNC-Chapel Hill department of orthodontics. She can reached at [email protected].
References
1. Trotman C-A, Faraway JJ, Silvester KT, Greenlee GM, Johnston LE Jr. Sensitivity of a method for the analysis of facial mobility: I. Vector of displacement. Cleft Palate Craniofac J. 1998;35:132-141.
2. Weeden JC, Trotman C-A, Faraway JJ. Three-dimensional analysis of facial movement in normal adults: Influence of sex and facial shape. Angle Orthod. 2001;71:132-140.
3. Trotman C-A, Faraway JJ, Essick GK. 3-D Nasolabial displacement during movement in repaired cleft lip and palate patients. J Plast and Reconstr Surg. 2000;105:1273-1283.
4. Trotman C-A, Faraway JJ. Sensitivity of a method for the analysis of facial mobility: II. Inter- landmark separation. Cleft Palate Craniofac J. 1998;35:142-153.
5. Nooreyazdan M, Trotman C-A, Faraway JJ. Modelling facial movement: II. A dynamic analysis of differences due to orthognathaic surgery. J Oral Maxillofac Surg. 2004;62:1380-1386.
6. Lee JY, Han Q, Trotman C-A. Three-dimensional facial imaging: Accuracy and considerations for clinical applications in orthodontics. Angle Orthod. 2004;74:587-593.
7. Bailey LJ, Cevidanes LHS, Proffit WR. Stability and predictability of orthognathic surgery. Am J Orthod Dentofacial Orthop. 2004;126(3):273277.
8. Mah J, Hatcher D. Three-dimensional craniofacial imaging. Am J Orthod Dentofacial Orthop. 2004;126(3):308-309.
9. Mozzo P, Procacci C, Tacconi A, Martini PT, Andreis IA. A new volumetric CT machine for dental imaging based on the cone beam technique: preliminary results. European Radiology. 1998; 8(9):1558-1564.
10. Yushkevich, P. ITK-SNAP Integration, NLM Insight. Available at: http://www.itk.org/index.htm
11. Maes F, Collignon A, Vandermeulen D, Suetens P. Multimodality image registration by maximization of mutual information. IEEE Trans Med Imaging. 1997;16(2):187-198.
12. Gerig G, Jomier M, Chakos M. Valmet: A new validation tool for assessing and improving 3D object segmentation. In: Medical Image Computing and Computer-Assisted Intervention-MICCAI 2001: 4th International Conference Utrecht, the Netherlands, October 14-17, 2001, Proceedings. Gerig G, Jomier M, Chakos M, eds. 2001;2208:516-528.