Taking data in bite-size pieces, and tackling your practice like the CEO of a business, can affect real, positive change in your practice.
By Suzanne Wilson
You’ve likely heard orthodontic experts and industry pundits call for better practice data, but your practice may still lag behind when it comes to monitoring and analyzing metrics. It’s time to reassess how that data can empower you to make informed decisions to give your business a greater competitive edge.
As in all industries, orthodontics continues to progress toward data management and data-driven decision-making, separating the pioneers from the followers who are working to catch up.
Robust data analysis and data-led decisions are not simply trends. Common sense tells us—and studies show—that practices that adopt data-driven decision-making enjoy a higher level of output and productivity. Specifically, there are some clear examples of why your orthodontic practice should collect better data, and how insights from that data can affect real, positive change in your business.
Better Practice Data Can Improve Collections
While tracking net collections is a must-do, most practices don’t dive deep enough to gain a true picture of their financial health. Collections are just one part of the equation and simply tracking data doesn’t help you understand if there are problems. Putting your data to work by leveraging insights from a grouping of data and putting it in a visual format helps you understand the next steps to take and how to increase your collections.
For example, consider the number of no-show patients. This simple metric alone can tell you a lot about opportunities to improve your operations and increase collections. Let’s say you’re already tracking no-shows: Your number of no-show patients makes up approximately 7% of your total appointments, and your average collection per visit is $250. Your business has always tolerated these missed collections and performs just fine otherwise. But look deeper…
What if you had the dataset to show that the industry standard was actually 5% no-shows, and regional comparisons for similar offices in your area only had 4% no-shows? Suddenly, it’s clear there’s an issue where you didn’t see one before. A loss you previously tolerated becomes the difference between your practice and your competitor—giving them an advantage. This data could incite you to change your appointment messaging, look into new scheduling options, scheduling reminders, staff training, and other methods to prioritize appointments, all of which could help increase profitability and efficiency per visit.
Better Practice Data Can Reduce Prospective Patient Attrition
Another common metric is new patient flow. If you’re keeping an eye on the number of patients coming through your door, that should be good enough, right? Not quite.
Let’s say, in addition to new patients, you begin tracking initial phone calls as patient adds to your system. In doing so, you might discover that the number of patients calling to learn more about your practice is only converting to 50% who schedule an initial appointment. New patient opportunities are dropping off before they even come into your office, and that’s a major problem relating to your patient acquisition and conversion. This information suggests there may be work to be done on your initial greeting, your intake protocol, marketing and importantly your availability for new consults. Visibility to this issue is not exactly earth shattering, but note what it can mean for your marketing return on investment and with a few simple internal fixes, watch that conversion ratio go up.
Another metric critical to your success is case acceptance. Many experts consider this to be one of the most important key performance indicators (or KPIs) your practice measures. Let’s say out of the 50% of patients that called and came in for a consult, only 60% started treatment with you. By tracking this metric and measuring it against industry benchmarks and other offices like yours, you might see that your case acceptance isn’t exactly up to par. From here, you can now consider possible solutions such as a TC and doctor script or protocol, doubling down on patient education, offering a greater variety of treatment options, payment options or perhaps changing your messaging tactics when delivering treatment plans, thereby increasing treatment starts.
Better Practice Data Can Enhance Operational Efficiency
There’s a chance you’re already measuring many of these practice metrics, but that doesn’t guarantee the way you collect data is efficient. If you or your staff are manually gathering and inputting performance data into spreadsheets, pulling and sifting through reports and spending significant time compiling, let alone interpreting the data, these are strong indicators that your practice is not being operationally efficient. Even with robust practice management software in place, orthodontic practices are still missing the comprehensive level of data analysis necessary for practice health. It’s a mistake to view your business only from a clinical perspective—though patient care is top priority—your competition is waiting for the opportunity to eat your lunch. The solution is a better practice performance data analysis tool.
With the proper data analysis tool, you can automate the process of measuring practice performance information. This saves time and resources that could be devoted to improving your practice, creating a better patient experience, team environment and the operational efficiencies that will truly drive long term revenue and profitability. Data automation produces reliable, accurate practice analysis by eliminating the risk of human error from manual data entry. Furthermore, the right tools will help visualize data in eye-opening ways, allowing you to quickly catch nuances and insights that would be much more obscured in a report or clunky spreadsheet.
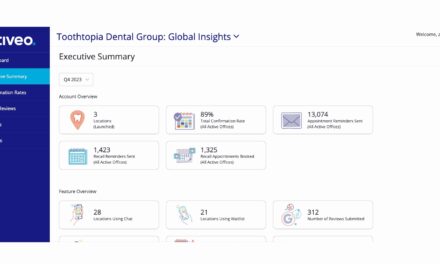
Visualization of Information Accelerates Your Reaction Time to Opportunities and Setbacks
It’s not necessarily the size of a dataset that matters most (although it certainly helps when identifying large-scale trends) but rather how fast you can react to it. By drastically reducing the amount of time you spend looking at data and figuring out what to do, you can use your expertise to act quicker and take advantage of opportunities or reverse setbacks as soon as they appear. And the best way to accelerate data analysis is through visual dashboards.
The best data analysis tools provide intuitive visual representations of a practice’s performance. By seeing your practice performance data through graphs and charts, you waste less time trying to digest and understand data and more time responding to important data findings. Furthermore, visuals can steer you away from bad assumptions or incorrect “gut feelings” about your data.
Get the Metrics, Benchmarks, and Reporting You Need to Compete and Win
Imagine a vast warehouse of data that contains the secrets to running a better business… but you can’t get inside. Every practice that’s capturing data through practice management software is sitting on “warehouses” of operational data. The trick is to ensure all that data is synthesizing, analyzing, and displaying trends and insights that result in something that can be translated into meaningful action. For all the good that large quantities of data can bring to a practice, none of it is usable without a way to clearly see how it impacts the big picture.
No matter the size of your practice, you must harness the power of data to first sustain your success in a competitive market, but second, how else can you effectively manage without understanding what’s driving and equally important, what’s dragging your practice? Leveraging data takes out the guesswork and provides facts to build upon. Whether you’re focused on operational insights or industry benchmarks, the right data will augment your approach and help you understand why your practice performs like it does, support you in your efforts to implement the highest priority changes, measure your results, and follow a path of continuous improvement.
The task of tracking the essential practice KPIs doesn’t have to be daunting. Take it in bite-size pieces, tackling your practice like the CEO of a business. With business intelligence tools, software automation, comparison data plus the expertise of industry benchmarks, your practice can establish where you truly are and then unleash the clarity required for your go-forward plan on achieving your goals. OP
Suzanne Wilson is chief marketing officer at Gaidge, the leader in orthodontics business intelligence and practice analytics. A driven marketing leader with over 20 years’ experience in medical devices, Suzanne is an expert in strategic planning, customer insights, data-driven decision-making, and brand building.