by Richard P. McLaughlin, DDS
Treatment planning of the dentition
Diagnosis and treatment planning of the orthodontic patient involves the evaluation of four areas: the TMJs and musculature, the airway, the face, and the dentition and periodontal structures. It is best to evaluate the first three of these areas and determine the treatment plan for each area. Once this has been done, the dentition and periodontal structures can be treatment planned. Using what I call “the dental visual treatment objective” (VTO) enables the clinician to plan precise, quantifiable movement of the dentition based on the clinical examination and treatment-planning values entered on a worksheet or into the McLaughlin Dental VTO available in Dolphin Imaging. The analysis provides specific information concerning the movement of midlines, cuspids, and molars once the desired incisor positions have been established using the cephalometric analysis. The dental VTO can be used for both orthodontic cases and surgical orthodontic cases,1 but I’ll describe only the orthodontic evaluation in this article.
 |
The initial charting for the VTO can be done at the initial examination. Facial and intraoral photographs and panorex x-rays allow observation of the midline-molar position as well as the crowding, spacing, and curve of Spee values. A cephalometric x-ray and mounted centric relation (CR) study models will confirm midline and molar positions, and will help complete the charting and establish the proposed dental movements. The total time required to do the VTO is about 10 minutes once the records have been obtained.
 |
| Richard P. McLaughlin, DDS |
Dental Treatment Planning
After you have made a decision concerning the best possible position for the incisors in the dental arches and the face, it is necessary to position the remainder of the dentition relative to the desired incisor positions. There are multiple decisions to be made in this regard. What are the vertical, horizontal, and transverse considerations? Can the case be treated on a nonextraction basis, or will extractions be necessary? What about habits and other influences on the dentition? Is the case surgical, or can dental compensations be established that are healthy, stable, and aesthetic?
Desired tooth movements are planned to establish the best possible results, and these movements should not be based only on intuition, experience, and subjective judgement. Growth is difficult or impossible to predict. However, reasonable estimates can be made, basing objective decisions on all the known factors. Growth can be monitored as treatment proceeds so that you can make the best possible decisions for the patient. Answers to certain basic questions provide valuable information about many other factors. These questions are:
- After incisor anterior, vertical, and torque positioning has been established, how are the midlines to be set up?
- Where are the canines to be moved?
- Where are the molars to be moved?
After you answer these questions, you can position premolars and second molars accordingly. In nongrowing patients, accurate calculations can be made on all midline, canine, and molar movements. For growing patients, lower-arch dental movements can be calculated accurately. However, upper dental movements must be estimated initially and monitored as growth and treatment progress.
The Dental VTO
I use three charts to record dental positions and proposed dental movements:
 |
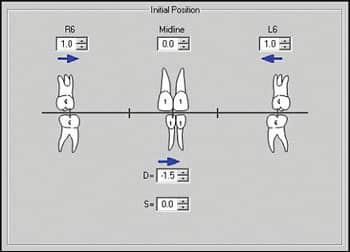 |
| Chart 1: The patient shows molars that are 1 mm Class II on each side. The upper dental midline is symmetrical (centered on the upper lip), and the lower dental midline is 1.5 mm to the left. The figure at left is handwritten, and in the figure at right, measurements are recorded in Dolphin Imaging. |
Chart 1 records midline and molar relationships. It is essential that these factors be recorded with the mandible in centric relation. Arrows are used to record the direction of Class II or Class III molar relationships and left or right midline deviations. In the lower arch, midline deviations should be recorded as dental (D) and/or skeletal (S). Midline deviations due to functional side shifts are not recorded, since they represent deviations from CR, and the case needs to be analyzed in CR. Place numbers in millimeters adjacent to the arrows in each area.
 |
| Chart 2 records the lower arch discrepancy and curve of Spee. |
 |
| The same information recorded in Dolphin Imaging. |
Chart 2 records the lower arch discrepancies in two columns: the 3 to 3 columns on the left, for factors occurring from canine to canine, and the 7 to 7 columns on the right, for factors related to the entire lower arch.
Each column is divided into right and left sides. These breakdowns are required to provide specific information concerning movement of the canines and the molars. The following factors are recorded:
- Crowding or spacing in the anterior segment. This is recorded as a negative number for crowding and a positive number for spacing in the 3 to 3 column. The same figures are automatically recorded in the 7 to 7 column.
- Crowding or spacing in the premolar regions. This is recorded only in the 7 to 7 column, as it does not affect the anterior segment from 3 to 3.
- Crowding or spacing in the molar area. This also is recorded only in the 7 to 7 column.
- Curve of Spee. By placing a rule from the most distal molar of the central incisor on each side of the lower arch, you can measure the deepest point of the curve of Spee (usually in the premolar region) in millimeters. The curve of Spee may be different on the left and right side. Similar amounts are automatically recorded in the 7 to 7 column.
- Midlines. Negative or positive figures are recorded in both midline deviations recorded in Chart 1. If lower skeletal midline deviations exist, and a decision is made to correct these deviations with dental compensations, the correction must be added to the lower dental midline area of Chart 1 and then to Chart 2. if the skeletal deviation is to be corrected surgically, then no correction is added to Chart 2.
- Incisor position. Anterior or posterior movement of the lower incisors is recorded as positive or negative numbers. The amount of this movement is based on clinical evaluation of the soft tissue and cephalometric records. For example, 1 mm of anterior movement provides 1 mm of space per side and would be recorded on the right and left sides of the 3 to 3 column. The same figures also would be recorded in the 7 to 7 column. Similarly, 2 mm of posterior incisor movement would be recorded as -2 mm in both the 3 to 3 and the 7 to 7 columns. In this example, a decision was made to leave the lower incisors in their original A/P position and to limit their vertical eruption as the posterior teeth erupted. The upper incisors could then be retracted approximately 2 mm, reducing upper and lower lip protrusion. An estimated growth prediction can be carried out after planned incisor movements. This allows for subjective preferences to be verified with objective information.
- Initial discrepancy. This amount represents the total of the information gathered to this point in the lower arch analysis. This is an appropriate time to decide if the case will be treated on a nonextraction basis (with possible interproximal reduction, expansion, or distalization of first molars) or if extraction treatment is indicated.
- Interproximal enamel reduction (stripping). If enamel reduction is indicated from canine to canine, this figure is recorded as positive figures in the 3 to 3 column. The same amounts also should be recorded in the 7 to 7 column.
- Expansion. If you plan for intercanine expansion in a particular case, this figure is recorded as positive figures in the 3 to 3 column. The same amounts should be recorded in the 7 to 7 column. If premolar or molar expansion accompanies this 3 to 3 expansion (which is usually the case), the amounts must be added to the 7 to 7 column as well.
- Distalizing of lower first molars. If you plan to upright or distalize the lower first molars, then positive numbers can be recorded in the 7 to 7 column only, since this will not affect the 3 to 3 discrepancy.
- Extraction. If a lower incisor is to be extracted, then the millimeters gained can be recorded in the left or right areas of the 3 to 3 column. The same amounts will be automatically recorded in the 7 to 7 column. If premolars (or occasionally, first molars) are to be extracted, you can record positive numbers in the 7 to 7 column.
- Remaining discrepancy. This records a total of the initial discrepancy and the space gained in millimeters by the treatment methods used in the lower half of the chart in both the 3 to 3 and 7 to 7 columns.
 |
 |
| Chart 3 shows the planned dental movements for the patient’s midlines, canines, and molars. The computer is capable of graphically illustrating all of these changes. |
Chart 3 provides specific information on the planned movement of midlines, canines, and molars. The categories are as follows:
- Lower midline correction. This is based on the original lower dental midline position recorded in Chart 1.
- Lower canine movement. This is based on the “Remaining Discrepancy” at the bottom of the 3 to 3 column in Chart 2. A negative figure in this column requires distal movement of the canine an equivalent amount. A positive figure in this column requires mesial movement of the canine an equivalent amount.
- Lower premolar/molar space. Just behind the recorded lower canine movement is a figure that represents the original spacing or crowding in the premolar/first molar region, as well as the space gained in this area as a result of such treatment procedures as extractions, stripping, posterior arch expansion or constriction, or distalizing of first molars.
- Lower first molar movement. The movement of the lower molars is based on the required movement of the canine’s available space in the premolar region.
- Upper first molar movement. The planned movement of the upper molars is based on the original molar relationship recorded in Chart 1 as well as the movement recorded for the lower molars.
This is a static calculation, and it does not take into account growth changes. A growth prediction can be carried out on the original cephalometric radiograph, but such predictions are based on average estimates and cannot be relied upon for accuracy.
- Upper premolar/molar space. Just anterior to the recorded upper molar movement is a figure that represents the original spacing or crowding in the premolar/first molar region, as well as the space gained in this area as a result of treatment procedures such as extraction, stripping, posterior arch expansion or constriction, or distalizing of first molars.
- Upper canine movement. The movement of the upper canines is based on necessary movement of the upper molars and the available space in the premolar region.
- Upper midline correction. This is based on the original upper dental midline position recorded in Chart 1.
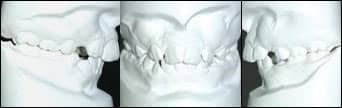
In the example in Figures 1.1–1.3, an estimated 8 mm of space was available on each side of the lower arch (7 mm from the premolar extraction and 1 mm of leeway space). In the upper arch, 9 mm was created from the extraction and 2 mm of leeway space. Calculations on the dental changes for the patient’s midlines, canines, and molars are recorded. The photos with the online version show the final results of the case. The incisors were placed in the face to provide a balanced profile, and the dentition was positioned behind the incisors. Four premolars were extracted.
In summary, the dental VTO is most useful in the diagnosis and treatment-planning process, and in making extraction/non-extraction decisions. Also, at patients’ regular adjustment appointments, the dental VTO serves as a reminder of desired tooth movements and anchorage needs.
Richard P. McLaughlin, DDS, is in private practice in San Diego.He has lectured in the United States as well as internationally.He is a diplomate of the ABO and the Southern California Component Director of the Edward H. Angle Society. He is a clinical professor in the Department of Orthodontics at the University of Southern California in Los Angeles, and an associate professor at St Louis University Department of Orthodontics. He can be reached at
Reference
- Arnett GW, McLaughlin RP. Facial and Dental Planning for Orthodontists and Oral Surgeons. Edinburgh: Mosby; 2004.
Additional Photos
 |
| Figures 1 to 3: Midline and molar relationships are recorded with the mandible in CR. The lower midline deviation can be recorded as dental (D) or skeletal (S). |
 |
|
| Figure 6: The crowding or spacing in the lower arch is evaluated and measured. | Figure 7: The curve of Spee is measured at the deepest part of the curve. |
 |
 |
 |
 |
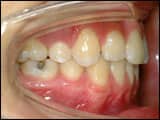
| Figures 12 to 16: The photos show the final dentition of the finished case. | |